Agronomía Costarricense 49 (2025) 544

Research Article
A simple method to determine soil moisture regime for highly weathered tropical soils
Manuel E. Camacho-Umaña 1/*, Warren M. Forsythe2, Alfredo Alvarado-Hernández3
*Corresponding author. Email: manuel.camachoumana@ucr.ac.cr
1 Universidad de Costa Rica, Escuela de
Agronomía y Centro de Investigaciones Agronómicas (CIA), San Pedro de Montes de
Oca, 11503-2060 San Pedro, Costa Rica. ![]() https://orcid.org/0000-0001-7589-8327
https://orcid.org/0000-0001-7589-8327
2 Universidad de Costa Rica, Centro de Investigaciones Agronómicas (CIA), San Pedro de Montes de Oca, 11503-2060 San Pedro, Costa Rica.
3 Universidad de Costa Rica, Centro de
Investigaciones Agronómicas (CIA), San Pedro de Montes de Oca, 11503-2060 San
Pedro, Costa Rica. ![]() https://orcid.org/0000-0002-6930-6660
https://orcid.org/0000-0002-6930-6660
DOI: https://doi.org/10.15517/e0cqsz43
Recibido el 07 de octubre 2024; Aceptado el 11de febrero 2025
Abstract
Introduction. The soil water balance approach can be used to evaluate soil water dynamics and determine soil moisture regime (SMR) and water availability. Despite some models are available in the literature, they have been validated within temperate regions, and require several input variables, restringing their use when data is limited. Objective. To develop a simple method to estimate soil water balance (after infiltration) and further determine the corresponding SMR for highly weathered soils from Costa Rica, Central America. Materials and methods. Twelve pedons (distributed in seven regions of Costa Rica) were sampled and described, where monthly total soil available water (TSAW) and available water in the soil control section (AWCS) were calculated. Potential evapotranspiration (ETo) and monthly dependable precipitation (DP) were estimated using historical data obtained from neighboring meteorological stations. DP, ETo, TSAW, and AWCS were used as variables in the calculations performed to identify months with soil water deficit. Results. Three SMRs were identified: 1) Ustic (six pedons), 2) Udic (four pedons), and 3) Perudic (two pedons). In five assessed pedons, SMR assigned through our soil water balance approach disagreed with that reported in the literature for nearby areas (SMR estimated through Newhall model). However, historical rainfall behavior and the developing crops and vegetation in these regions reinforced the SMR assigned to this research. Conclusions. The method developed in the present study was considered satisfactory in determining both soil available water and SMR for highly weathered soils of Costa Rica.
We encourage its use in further studies of hydrology, soil physics, and pedology due to 1) its versatility of use with limited data and 2) the inclusion of meteorological and edaphic variables calibrated under tropical conditions.
Keywords: soil water balance; dependable precipitation; Soil Taxonomy; Ultisols; Oxisols.
Artículo científico
Resumen
Un método sencillo para determinar el régimen de humedad en suelos tropicales altamente meteorizados
Introducción. El balance hídrico se puede utilizar para estimar la dinámica y disponibilidad del agua, así como el régimen de humedad del suelo (SMR). Pese a que en la literatura existen múltiples modelos para determinar este SMR, estos se validaron en regiones templadas y requieren de múltiples variables de entrada, restringiendo su uso en entornos con datos limitados. Objetivo. Desarrollar un método simple para estimar el balance hídrico del suelo (después de la infiltración) y determinar el SMR en suelos altamente meteorizados de Costa Rica, América Central. Materiales y métodos. Se muestreó un total de doce pedones (distribuidos en siete regiones de Costa Rica) y se calculó su contenido de agua disponible total (TSAW) y en la sección control del suelo (AWCS). A partir de datos obtenidos de estaciones meteorológicas aledañas, se calculó la evapotranspiración potencial (ETo) y la lluvia confiable (DP) mensual. Estas cuatro variables se utilizaron en los cálculos del balance hídrico del suelo para la identificación de los meses con déficit hídrico. Resultados: Se identificaron tres SMR: 1) Ústico (seis pedones), 2) Údico (cuatro pedones) y 3) Perúdico (dos pedones). En cinco pedones, el SMR asignado en el presente trabajo presentó diferencias con el reportado en la literatura (estimado mediante el modelo Newhall). Sin embargo, los patrones históricos de precipitación, así como los cultivos y vegetación imperantes en los sitios reforzaron el SMR asignado mediate el enfoque del balance hídrico desarrollado en el presente trabajo. Conclusiones. El método desarrollado se consideró satisfactorio en la determinación de la disponibilidad del agua y el SMR en suelos altamente meteorizados de Costa Rica. Se recomienda su uso en futuros estudios de hidrología, física de suelo y pedología, debido a: 1) su versatilidad de uso con datos limitados, 2) incorporación de variables climáticas y edáficas calibradas en condiciones tropicales.
Palabras clave: balance hídrico del suelo; lluvia confiable; taxonomía de suelos; Ultisoles; Oxisoles.
1. Introduction
Soils are considered a key ecosystem factor due to their functions in the hydrologic cycle, linking energy and water fluxes throughout the soil-plant-atmosphere continuum (Kramer 1969, Andersson et al. 2015, Buol et al. 2011). Therefore, pedology, hydrology and other emerging sciences like hydropedology are strongly relevant to both agricultural and ecological studies (Buol et al. 2011, Lin et al. 2006, Lin 2010, Bouma 2012).
Highly weathered soils within the tropical regions are commonly classified according to the system Soil Taxonomy system (Soil Survey Staff 1999) as Ultisols and Oxisols. These soil orders present interesting properties such as the presence of low-activity minerals, high content of fine particles (clay), low water retention and high permeability, in addition to low contents of exchangeable cations and high acidity (West et al. 1997, Buol and Eswaran 1999, Camacho et al. 2021). In Costa Rica, Ultisols and Oxisols correspond to 43.4% of the total surface area (Mata et al. 2020), covering agricultural regions where significant crops such as sugarcane (Saccharum officinarum L.), pineapple (Ananas comosus (L.). Merr.), or coffee (Coffea arabiga L.) represent the main economic activity (Camacho-Umaña et al. 2024).
In Soil Taxonomy, there is a fundamental concept denominated soil moisture regimen (SMR), defined as the presence or the absence of water retained within tensions among 33 and 1500 kPa into a specific depth (horizons) and during defined periods of the year (Soil Survey Staff 1999). This SMR is commonly used for suborder designation once taxonomic order has been appropriately identified (Soil Survey Staff 1999, Buol et al. 2011), and it takes more importance in agricultural planning and crop establishment according to agroecological interactions, aiming to achieve efficiency in water use and sustainability (Rai and Singh 2012, Lal 2015).
Normally, SMR is determined by estimating the number of days where available water within the soil profile’s control section (AWCS) reaches a tension higher than 1500 kPa, but without reaching the “air dry state” (Soil Survey Staff 1999). This determination can be achieved through a soil water balance approach inferred from historic meteorological data (Soil Survey Staff 1999, Tejedor et al. 2002, Buol et al. 2011, Winzeler et al. 2013). In this regard, some models are available in the literature to determine both soil moisture and temperature regime (Newhall 1972, van Wambeke 1987, 2000, Constantini et al. 2002, Winzeler et al. 2013), which simulates soil moisture behavior under a specific pattern of rainfall, and they are considered accurate for soil taxonomy studies in the United States and Europe.
Models mentioned above use monthly average precipitation (PM) inferred from “normal years” as water input (Soil Survey Staff 1999) and potential evapotranspiration (ETo) as water output. ETo can be estimated through calibrated equations (Penman 1948, Thornthwaite 1954, Monteith 1965), where many involve several climatic variables (Allen et al. 1998). For instance, the Penman-Monteith model is considered as the standard method for evapotranspiration estimating, but its use becomes limited when one or more input variables are absent. The equation developed by Hargreaves and Samani (1985) to estimate ETo from temperature and solar radiation values shows good correlation with the models mentioned above (Moeletsi et al. 2013) and has been used in soil hydrology studies worldwide (Bautista et al. 2009; Gentilucci et al. 2021), including specific studies in the tropics (de Sousa Lima et al. 2013, Lima Junior et al. 2018).
The behavior of the rainfall distribution in moist tropical regions is quite difficult to model and predict due to the influence of ENOS, Atlantic Multi-Decadal Oscillation, and Tropical North Atlantic (Larkin and Harrison 2005, Wolter and Timlin 2011, Maldonado et al. 2018). This makes it difficult to achieve the “normal years” condition in PM as required by Soil Taxonomy.
Furthermore, van Wambeke (1987) performed a study where SMRs were estimated using the Newhall model (Newhall 1972) for the whole territory of Costa Rica. More recently, Fernández-Moya et al. (2014) developed a soil-water balance approach to determine SMR in Andisols from the lands of Guanacaste. However, when carefully assessing these reported SMRs, there are discrepancies among the SMRs assigned with 1) the corresponding historical rainfall patterns and potential soil water availability and 2) the natural vegetation or specific crops developing within their corresponding regions.
2. Materials and methods
2.1. Study areas
Seven regions in Costa Rica were selected: a) Mountains of Hojancha, Guanacaste province; b) Mountains of Acosta, in San José; c) Talamanca piedmont at Valle del General and Buenos Aires, located in San José and Puntarenas provinces respectively; d) Mountains of Osa in Puntarenas; e) Lowlands of San Carlos in Alajuela; f) Highlands of Talamanca valley and g) Mountains of Tortuguero, both at Limón province (Figure 1). These regions were chosen following two main criteria: a) geological and geomorphological conditions were suitable for well-drained weathered soils development, and b) landscapes were randomly distributed within different climatic regions, aiming to cover as many of the possible scenarios on rainfall patterns as possible (Solano and Villalobos 2001). A review of soil genesis and soil forming factors for the pedons and landscapes are detailed in Camacho et al. (2021).
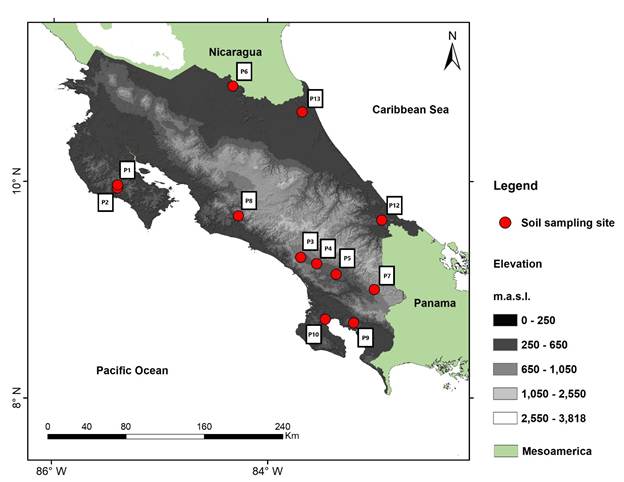
Figure 1. Digital elevation model and geographic localization of 12 pedons sampled and described in present study.
Figura 1. Modelo de elevación digital y localización geográfica de los 12 pedones muestreados y descritos en el presente estudio.
2.2. Soil sampling and data collection
Twelve pedons were sampled and described across Costa Rica (Figure 1). Soil descriptions were conducted following Schoeneberger et al. (2002). The geographic coordinates, physiography, relief, elevation and slope, soil erosion, apparent fertility, drainage, stoniness, and water table depth were determined for every pedon. In each horizon assessed, moist color was determined following Munsell (1994). Additionally, depth and width, structure features, consistency, pores, roots, and special features were described following Schoeneberger et al. (2002).
Soil physical and chemical analyses were conducted at Centro de Investigaciones Agronómicas, University of Costa Rica (hereafter CIA-UCR). Details about the methodologies employed can be easily accessed from Camacho et al. (2021).
In summary, soil water retention (SWR) at field capacity (FC at 33 kPa tension) and permanent wilting point (PWP at 1500 kPa tension) for each soil horizon were measured using undisturbed soil cores taken in rings (4.7 cm diameter and 2.54 cm height), using porous ceramic plates and pressure vessels which were set at tension values of 0.33 and 15 bar (33 and 1500 kPa) for FC and PWP, respectively, following the guidelines from Richards (1941), Klute (1986) and Soil Survey Staff (2014a). Particle size distribution analysis (PSDA) was measured using both: 1) pipette methods as described by Soil Survey Staff (2014a) and 2) modified hydrometer method (Gee and Or 2002). Bulk density was accessed through volumetric cylinder following Grossman and Reinsch (2002). Organic carbon contents (OC) were determined by dry combustion (Horneck and Miller 1998).
3. Theory
3.1. Atmospheric water balance
Data (daily minimum, maximum and average air temperature; daily average rainfall and solar radiation) was collected from several meteorological stations (a total of 23) near the soil sampling sites for the climate analysis of the landscapes studied (atmospheric water balance). The data source and the station’s features are detailed in Table 1. In addition, we consulted data from Handcock and Hargreaves (1977), who analyzed climatic data from 250 meteorological stations along the territory of Costa Rica. Daily potential evapotranspiration (ETo) was estimated following Hargreaves and Samani (1985):
![]() (1)
(1)
where ETo
is daily
potential evapotranspiration (mm
day-1), Tmed ![]() is daily average temperature (°C) and
Rs is solar incident radiation (mm day-1). If Rs
is not available within the climatic data, Samani (2000) proposed the following
equation to calculate Rs from temperature values:
is daily average temperature (°C) and
Rs is solar incident radiation (mm day-1). If Rs
is not available within the climatic data, Samani (2000) proposed the following
equation to calculate Rs from temperature values:
![]() (2)
(2)
where Ro is sun extraterrestrial radiation (MJ m-2 day-1). This Ro comes from tabulated data which values change according to the global position (Allen et al. 1998), which is multiplied by 0.408 to convert units to mm day-1; Tmax and Tmin are maximum and minimum daily temperature (°C), respectively, and KT is an empirical coefficient. Hargreaves (1994) recommended a KT = 0.162 for regions located inland and KT = 0.19 for coastal sites.
To calculate potential evapotranspiration (mm) for the n month, a sum of daily potential evapotranspiration values (calculated with equation 1) was conducted following the equation:
 (3)
(3)
where ![]() is potential evapotranspiration
for the n month (mm).
is potential evapotranspiration
for the n month (mm).
Dependable precipitation (DP) was estimated from annual precipitations records using the gamma distribution (Husak et al. 2007) and a threshold value of 75%, which is precipitation with a 75% probability level of occurrence (Hargreaves 1977). If data is limited to monthly values, DP can be calculated from monthly average precipitation values using the equation developed by Hargreaves (1977):
![]() (4)
(4)
where DP is dependable precipitation (mm), and PM is monthly average precipitation (mm). Our DP values were compared with those reported by Hancock and Hargreaves (1977) for neighboring sites to soils under study, including some of the same meteorological stations used in the present study. Data provided by Hancock and Hargreaves (1977) covered a wide range of years, varying from 25 to 45 years of data registration. Thus, their values can be considered representative and robust.
3.2. Soil water balance after infiltration approach
We propose a simplified method to estimate the soil water balance and soil moisture regime, based on the atmospheric water balance, soil water retention capacity (SWRC), and the water values that enter the soil profile as infiltration. From soil water retention and bulk density data obtained for each soil horizon, water storage capacity was estimated throughout the following equation:
![]() (5)
(5)
where θi is water storage capacity of the horizon (mm), wfci and wpwpi are gravimetric water content values (g g-1) at field capacity (FC) and permanent wilting point (PWP) respectively; ρbi is bulk density (g cm-3), ρH2O is the water density (~ 1.0 g cm-3) and di is the horizon thickness (mm).
Table 1. Meteorological stations and climatic data period consulted for the water balance development.
Tabla 1. Estaciones meteorológicas y periodo de datos consultados para el desarrollo del balance hídrico.
|
ID number |
|
Name |
|
Latitude North |
Longitude West |
Elevation (masl) |
|
Data registering period |
|
Source |
|
69551 |
|
Guatuso |
|
10° 41' |
84° 49' |
50 |
|
Jan-1996 to Dec-2015 |
|
ICE (2015) |
|
69575 |
|
Upala |
|
10 ° 54' |
85° 01' |
50 |
|
Jan-1976 to Dec-1994 |
|
ICE (2015) |
|
69577 |
|
Boca Tapada |
|
10 ° 41' |
84° 13' |
60 |
|
Jan-1976 to Dec-1994 |
|
ICE (2015) |
|
69704 |
|
Barra del Colorado |
|
10° 46' |
83° 35' |
5 |
|
Jan-2011 to Dec-2014 |
|
ICE (2015) |
|
69633 |
|
Comando Los Chiles (Automatic) |
|
11º 01' |
84º 42' |
40 |
|
Dic-1994 to Nov-2015 |
|
IMN (2015) |
|
69635 |
|
Coopevega |
|
10º 43' |
84º 24' |
100 |
|
Sep-1995 to Dec-2015 |
|
IMN (2015) |
|
69713 |
|
Saint George, Los Chiles (Automatic) |
|
10º 46' |
84º 40' |
87 |
|
Apr-2013 to Nov-2015 |
|
IMN (2015) |
|
72105 |
|
Colonia Carmona, Nandayure |
|
10º 00' |
85º15' |
100 |
|
Jan-1970 to Jun-1991 |
|
IMN (2015) |
|
85012 |
|
Hitoi Cerere |
|
09º 40' |
83º 01' |
100 |
|
Jul-1981 to Dec-2015 |
|
IMN (2015) |
|
85021 |
|
Hitoi Cerere (Automatic) |
|
09º 40' |
83º 01' |
170 |
|
Jun-1995 to Sep-2015 |
|
IMN (2015) |
|
87010 |
|
Amubri |
|
09° 31' |
82° 57' |
70 |
|
Jan-1996 to Dec-2015 |
|
ICE (2015) |
|
87012 |
|
Alto Urén |
|
09° 27' |
82° 58' |
220 |
|
Jan-1993 to Dec-2006 |
|
ICE (2015) |
|
87014 |
|
Alto Lari |
|
09° 23' |
83° 02 |
600 |
|
Jan-1994 to Dec-2007 |
|
ICE (2015) |
|
87016 |
|
Bajo Coen |
|
09°32' |
83° 01' |
100 |
|
Jan-1994 to Dec-2007 |
|
ICE (2015) |
|
88005 |
|
San Ignacio de Acosta |
|
09º48' |
84º10' |
860 |
|
Jan-1950 to May-1980 |
|
IMN (2015) |
|
88045 |
|
San Ignacio de Acosta 2 |
|
09º 47' |
84º 09' |
880 |
|
Oct-1994 to Dic-2015 |
|
IMN (2015) |
|
98066 |
|
San Isidro de Biolley |
|
09° 00' |
82° 60' |
1050 |
|
Jan-1996 to Dic-2015 |
|
ICE (2015) |
|
98087 |
|
Pindeco, Buenos Aires |
|
09º 08' |
83º 20' |
397 |
|
Sep-1995 to Nov-2015 |
|
IMN (2015) |
|
nd |
|
Pérez Zeledón |
|
nd |
nd |
nd |
|
Jan-2010 to Nov-2015 |
|
ICAFE (2015) |
|
nd |
|
Hojancha, Guanacaste |
|
nd |
nd |
nd |
|
Jan-2010 to Nov-2015 |
|
ICAFE (2015) |
|
nd |
|
Finca La Ceniza, Pérez Zeledón |
|
09º 18' |
83º 41' |
754 |
|
Jan-2010 to Nov-2015 |
|
Coopeagri (2015) |
|
nd |
|
Finca El Porvenir, San Pedro |
|
09º 14' |
83º 32' |
596 |
|
Jan-2010 to Nov-2015 |
|
Coopeagri (2015) |
|
nd |
|
Finca El Guayacán, Buenos Aires |
|
09º 08' |
83º 21' |
380 |
|
Jan-2010 to Nov-2015 |
|
Coopeagri (2015) |
nd: no available data.
m asl: meters above sea level.
To estimate total soil available water (storage capacity), a sum of values of water storage capacity for the horizons calculated with equation 5 was conducted, following the equation:
 (6)
(6)
where A is the total soil water storage capacity (mm).
For the calculus of monthly soil water balance, we assumed a runoff value equivalent to 5% of DP when DP (monthly DP) was higher than 30 mm, in agreement with runoff values obtained from several studies conducted under similar climatic conditions and geomorphologic features within Costa Rica (Harmand et al. 2007, Cannavo et al. 2011, Villatoro et al. 2015).
Then, we assumed an average water value that infiltrates into the soil profile, which was estimated by the following equation:
![]() (7)
(7)
where In is the average water content that infiltrated into the soil profile for month n (mm); DPn is dependable precipitation value for n month (mm) and En is average runoff value for n month. Further, we estimate the soil water balance after the infiltration for every evaluated month, through the following equation:
![]() (8)
(8)
where ![]() is soil water
balance after infiltration for n month (mm), In is the
average water content stored into the soil profile for month n (mm) per equation
7 and
is soil water
balance after infiltration for n month (mm), In is the
average water content stored into the soil profile for month n (mm) per equation
7 and ![]() is potential
evapotranspiration for n month estimated with equation 3.
is potential
evapotranspiration for n month estimated with equation 3.
From Batn values, a conditional function was established to estimate the number of months where soil total water storage capacity (A) is consumed to the limit as shown by equation 9:
 (9)
(9)
where ![]() is the available
water for month n (mm),
is the available
water for month n (mm), ![]() is atmospheric water balance on
infiltrated soil for n month (mm) and
is atmospheric water balance on
infiltrated soil for n month (mm) and ![]() is atmospheric water balance on
infiltrated soil for previous month (mm).
is atmospheric water balance on
infiltrated soil for previous month (mm).
This function begins on the first
month of the year where ![]()
![]() , that means the month where pedon
is virtually wet. Then, this function is applied until obtaining a complete
year (12 months).
, that means the month where pedon
is virtually wet. Then, this function is applied until obtaining a complete
year (12 months).
This last calculus normalizes soil
water content because 1) soil can’t hold more water than A, and 2) negative
values of ![]() correspond to water deficit (soil available
water decreased).
correspond to water deficit (soil available
water decreased).
A second calculus with equation 9 was performed to estimate SMR but substituting the A value by the available water on soil pedon control section (AWCS). According to Soil Survey Staff (1999), the moisture control section of a given soil extended from 10 to 30 cm below the soil surface if the particle-size class of the soil is fine-loamy, coarse-silty, fine-silty, or clayey. This last one (clayey) was the dominant textural class within the pedons assessed in the present research, with clay values of 40 - 64% for Ap and 44 - 79% for Bt horizons (Camacho et al. 2021).
Therefore, the AWCS was estimated per equations 5 and 6 for each pedon but using the corresponding horizons which were sampled and described within 10 and 30 cm depth, and considering the thickness di, following the guidelines from Soil Survey Staff (1999) for clayey soils.
3.3. Soil limited data and pedotransfer functions as an alternative for SWR inputs
Aiming to extend the scope of soil water balance after infiltration in further studies using this simple method to other soils with limited data (e.g. soil profiles without measured SWR values), pedotransfer functions (PTFs) available on software Rosetta1 (Schaap et al. 2001) were used to estimate fit parameters for the van Genuchten model (van Genuchten 1980). This model describes the water retention function that describes the relation between the soil water content (θh) and its corresponding soil water potential (h):
 (10)
(10)
where θs and θr are the saturated and residual water contents (L3 L-3), respectively; α (L-1) and n (unitless) are empirical fitting parameters; m is related to n by m = 1 – 1/n (unitless), and h is the tension value (cm H2O). The parameters θs, θr, α, and n were estimated for each soil horizon assessed using Rosetta1, which calculates these fit parameters from the corresponding particle size distribution analysis (PSDA), bulk density and organic carbon content (OC). More details about the PTFs and corresponding methodologies employed can be easily accessed from Schaap et al. (2001).
Once fit parameters were obtained for each soil horizon, soil water content for field capacity (FC) and permanent wilting point (PWP) was calculated through equation 10, setting h values of 336.5 and 15295.74 cm H2O, respectively.
Because the van Genuchten’s model calculates directly volumetric water content (θ), water storage capacity of the horizon (li) was estimated with a modification of equation 6:
 (11)
(11)
where θfci and θpwpi are volumetric water content values at field capacity (FC) and permanent wilting point (PWP) respectively; and di is the corresponding horizon thickness (mm).
The calculated water content values at FC and PWP were compared with their corresponding measured values through single linear regression analysis, aiming to evaluate the performance of pedotransfer equations. Regression analyses were performed on R Studio® (R version 4.3.0 (2023-04-21) "Already Tomorrow") using the glm procedure (RStudio Team 2015).
3.4. Soil moisture regime assignment (SMR)
After the soil water balance approach was completed for each pedon, the number of days for months where AWCS was totally depleted were computed, and further SMR was assigned following the guidelines of Soil Survey Staff (1999). A summary of the description of soil moisture regimes (reported in Costa Rica) is detailed on Table 2.
Soil moisture regimes assigned for pedons assessed in the present study were compared with those previously assigned for Costa Rica by van Wambeke (1987) through: 1) the spatial location of current pedons within the soil moisture regimes distribution map adapted from van Wambeke (1987), and 2) comparing soil moisture regime reported for climatologic stations nearby the pedon sampling points in Costa Rica. After soil moisture regimen was determined for each pedon assessed, soils were classified to the Taxonomic Subgroup level following guidelines from the last edition of Keys to Soil Taxonomy (Soil Survey Staff 2014b).
4. Results
4.1. Soil water content and pedotransfer functions performance
Low values of available water (θfc - θpwp) were found for all horizons studied (n = 57), with a range between 0.04 and 0.13 cm3 cm-3 (Figure 2A). Consequently, we observed low values for both total soil (TSAW) and available water in the control section (AWCS) for the twelve pedons assessed, where AWCS estimates were relatively lower than 50 mm (Figure 2B), which is a fixed value used in the Newhall model and Soil Survey Staff (2014b) for estimating soil moisture regime (SMR).
Soil volumetric water content values at FC and PWP calculated through the van Genuchten’s equation (using pedotransfer functions) for soil horizons presented a strong relation with those directly measured from soil samples (R2 values of 0.92 and 0.89, respectively). Despite this behavior, the RMSE values estimated for FC and PWP were 0.11 and 0.07 cm3 cm-3, respectively, which suggest considerable differences (higher than 0.05 cm3 cm-3) between measured and predicted values. Notoriously, the volumetric water content values calculated for FC and PWP were lower than those directly measured (Figure 3A). Conversely, the available water values calculated with Rosetta® were higher than those directly measured from soil samples (Figure 3B). These same values presented a lower relationship with those directly measured (R2 = 0.60), with a RMSE value of 0.04 cm3 cm-3.
Our data suggested that pedotransfer equations used in the present study (Rosetta1®) to estimate water content at field capacity and permanent wilting point underestimated the water content at both hydrological reference values (FC and PWP) and overestimated the available water by about 24% when compared with the measured values (Figure 3B)
4.2. Soil water balance after infiltration estimated for highly weathered soils
The results obtained with this proposed water balance approach for the twelve pedons assessed are detailed in Figures 4 and 5. We included the atmospheric water balance (ETo vs DP) and the associated total soil available water (TSAW). While assessing pedons P1 and P2 (Mountains of Hojancha) the values of dependable precipitation (DP) and potential evapotranspiration (ETo) indicate eight months (November - May, and July) where atmospheric water balance is negative (ETo > DP), modifying water input and its corresponding soil water stored during the year (Figure 4 A and B). A bimodal rainfall pattern caused by a short drought period in July, which added to maximum rainfall values in September and October, limited the TSAW to 5 months, then seven months where soil profiles present water deficit.
Similar behavior was found in the landscape Talamanca Piedmont landscape which is oriented to Valle del General (Figure 4 C, D and E), where negative atmospheric water balance extended for just five months (December - April), conditioning water availability for pedons studied. In this regard, pedon P3 showed a deficit of water available for four months (January-April), while in pedons P4 and P5 the water deficit extended to five months (December - April). High rainfall values allow water availability during seven and eight months of the year (Figure 4 C, D and E).
Table 2. Description of soil moisture regimes (SMR) reported in soils of Costa Rica.
Tabla 2. Descripción de los regímenes de humedad del suelo (SMR) reportados en suelos de Costa Rica.
|
Soil moisture regime |
|
Main characteristics |
|
|
|
|
|
Aquic |
|
Soil is virtually out of oxygen due to saturation. |
|
|
Soil remains saturated for some period of the year, during normal years. Evidence of chemical reduction. |
|
|
Perudic |
|
Soil presents a hydric surplus for 12 months (ET0 < PM*) in the control section. |
|
|
Soil does not get dry during no period of the year. |
|
|
Udic |
|
Soil presents a hydric surplus (ET0 < PM*) for 90 cumulative days or even more in the control section. |
|
|
Soil dries for a period shorter than 90 cumulative days of the year. |
|
|
Ustic |
Soil presents a hydric deficit (ET0 > PM*) for 90 cumulative days or even more in the control section. |
|
|
|
Soil dries for a period longer than 90 cumulative days of the year and gets moist during 180 cumulative days or 90 consecutive days per year. |
|
|
*PM: Monthly mean precipitation inferred from normal years (Soil Survey Staff 1999). All this information was adapted from Alvarado (1985), Soil Survey Staff (1999) and Boul et al. (2011). |
||
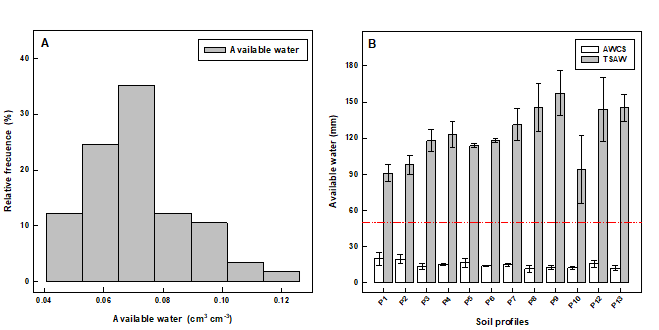
Figure 2. Relative frequency of available water values measured from soil horizons sampled (A) and calculated total soil available water (TSAW) and available water in the control section (AWCS) for twelve pedons assessed in present study (B). Error bars represent 95% confidence interval. Discontinuous red line denotes 50 mm as AWCS as suggested by van Wambeke (1987) and Soil Survey Staff (1999).
Figura 2. Frecuencia relativa de los valores de agua disponible medidos en los horizontes del suelo muestreados (A) y valores calculados de contenido total de agua disponible del suelo (TSAW) y agua disponible en la sección de control (AWCS) para doce pedones evaluados en el presente estudio (B). Las barras de error representan el intervalo de confianza del 95%. La línea roja discontinua indica 50 mm como AWCS, según lo sugerido por van Wambeke (1987) y Soil Survey Staff (1999).

Figure 3. Calculated volumetric moisture values at field capacity (FC) and permanent wilting point (PWP) (A) and, available water (B) plotted against measured values for horizons sampled on twelve soil pedons assessed on present study. Red lines indicate fitted linear regression models. Calculated values for FC and PWP were estimated through van Genuchten equation (van Genuchten 1980), using fitting parameters obtained through Rosetta1 (Schaap et al. 2001).
Figura 3. Valores de humedad volumétrica calculados para capacidad de campo (CC) y punto de marchitez permanente (PMP) (A), y valores calculados de agua disponible (B), graficados frente a los valores medidos en los horizontes muestreados de doce pedones evaluados en el presente estudio. Las líneas rojas indican los modelos de regresión lineal ajustados. Los valores calculados de CC y PMP fueron estimados mediante la ecuación de van Genuchten (van Genuchten, 1980), utilizando los parámetros de ajuste obtenidos a través de Rosetta1 (Schaap et al. 2001).
The atmospheric water balance estimated for pedon P6 (lowlands of San Carlos) showed water deficit in just three months (February - April), with high precipitation values except for September and January, where there is a significant decrease in precipitation values. The landscape’s magnitude and rainfall distribution made it possible for ten months with high values of soil available water (May - February), further depleting TSAW completely from March to April (Figure 4 F).
For pedon P7 (Talamanca Piedmont oriented to Buenos Aires), the atmospheric water balance was negative for four months only (December - March). This period of decay in rainfall significantly reduced available water during the first four months, depleting completely TSAW for two months (February and March) but with available water for the rest of the ten months (Figure 5 A).
Curiously, when assessing the Mountains of Acosta landscape, the atmospheric water balance was similar to that found for landscape in Hojancha (Figure 4 A and B) with a precise period (July - August) where the rainfall amount decreased considerably. Due to this behavior, pedon P8 showed available water for seven months (May - November) and a five-month period (December - April) during which time TSAW was depleted entirely (Figure 5 B).
High precipitation rates characterize the southeastern region of Costa Rica. There is the landscape Mountains of Peninsula de Osa, where the atmospheric water balance showed a rainfall decrease from January to March and maximum precipitation values from September to October. The two pedons studied within this landscape (P9 and P10) presented differences in the TSAW. Pedon P9 was depleted entirely during March (one month), while this depletion extended for February and March in pedon P10 (Figure 5 C and D).
On the other hand, the Caribbean region
of Costa Rica presents weather conditions with high rainfall events distributed
during the year. The atmospheric water balance in the Highlands of Talamanca
showed a water surplus for nine months (DP > ![]() ), with a precise period where the rainfall
decreases (March and April), coinciding with a reduction on TSAW for pedon P12
during those months mentioned above (Figure 5 E). Nevertheless, this pedon
did not show a deficit in available water (where soil gets totally dry) throughout
the year.
), with a precise period where the rainfall
decreases (March and April), coinciding with a reduction on TSAW for pedon P12
during those months mentioned above (Figure 5 E). Nevertheless, this pedon
did not show a deficit in available water (where soil gets totally dry) throughout
the year.
Similar behavior was found in the Mountains of Tortuguero (pedon P13), where the surplus period extended for ten months with a reduction in rainfall during March-April. DP values were higher for this landscape than those values found in the Highlands of Talamanca. Indeed, a similar behavior to pedon 12 was found for pedon 13, where there was a decay in TSAW for March and April, without a clear soil water deficit (Figure 5 F).
4.3. Soil moisture regime, water availability and production potential
While evaluating the behavior of available water in the control section (AWCS) for the twelve pedons assessed in the present study (Table 3), we found agreement with TSAW trends described above in the soil water balance after infiltration (Figures 2 and 3). From these results, pedons were grouped into three categories following the guidelines described in Table 2:
1) Pedons with water deficit (virtual depletion of available water) in the control section for 90 or more cumulative days during the year were classified within the Ustic soil moisture regime (Ustic SMR).
2) Pedons with a water deficit in the control section for less than 90 cumulative days were classified within the Udic soil moisture regime (Udic SMR).
3) Pedons with no water deficit in the soil control section throughout the year were classified within the Perudic soil moisture regime (Perudic SMR).
The first group included pedons studied in landscapes Mountain of Hojancha (P1 and P2), Talamanca piedmont oriented to Valle del General (P3, P4 and P5), and Mountains of Acosta (P8) (Table 3). Pedons P1 and P2 presented a water deficit on AWCS for almost six consecutive months (212 cumulative days). Soil water deficit in the control section for pedon P3 extended for 120 cumulative days (four consecutive months), while for pedons P4 and P5 extended for 151 cumulative days (five months).
Similarly, pedon P8 presented a total of 151 cumulative days (five consecutive months) with water deficit. All these aforementioned results allowed us to classify these six pedons under the Ustic SMR, with a period of time of 90 consecutive days or more with water deficit in the control section (Figures 4 A-E and 5B).
The second group included pedons from the landscapes Lowlands of San Carlos (pedon P6), Talamanca piedmont oriented to Buenos Aires (pedon 7), and Mountains of Península de Osa (pedons P9 and P10). Pedons P6 and P7 presented AWCS totally depleted for two consecutive months (61 and 59 consecutive days respectively). Pedons P9 and P10 presented an AWCS deficit for 31 and 59 consecutive days. Therefore, Udic SMR was assigned to these four pedons (less than 90 or consecutive days with AWCS hydric deficit) (Table 3).
Finally, soil sampled and described in the landscapes Highlands of Talamanca Valley (pedon P12) and Mountains of Tortuguero (pedon P13) were included in the third group (Table 3). Both pedons presented AWSC surplus throughout the whole year (no deficit period for 365 days). Therefore, both pedons were classified within the Perudic SMR (no AWCS total depletion along the year), in agreement with the conditions described on their corresponding soil water balance, where soil holds available water for twelve months, with a reduction in total available water during moths where DP < ETo but without depleting it totally (Figure 5 E and F).

Figure 4. Soil water balance after infiltration calculated for soil pedons: Altos del Socorro (A), San Isidro, Monterromo (B), La Ceniza (C), El Porvenir (D), El Guayacán (E), and Crucitas de Cutris (F). 2016. DP: dependable precipitation (mm), ETo: potential evapotranspiration (mm), T: temperature (°C), A: soil total available water (mm). Red slashed lines represent 50 mm of available water in the moisture control section (AWCS) as established by Soil Survey Staff (1999).
Figura 4. Balance hídrico del suelo posterior a la infiltración calculado para los pedones: Altos del Socorro (A), San Isidro, Monterromo (B), La Ceniza (C), El Porvenir (D), El Guayacán (E) y Crucitas de Cutris (F). 2016. DP: precipitación confiable (mm), ETo: evapotranspiración potencial (mm), T: temperatura (°C), A: agua total disponible en el suelo (mm). Las líneas rojas discontinuas representan 50 mm de agua disponible en la sección de control de humedad (AWCS), según lo establecido por el Soil Survey Staff (1999).

Figure 5. Soil water balance after infiltration calculated for six pedons: Biolley (A), Colorado de Acosta (B), Estación La Gamba (C), Rincón de Osa (D), Los Ángeles, Talamanca (E) and Cerro Coronel (F). DP: dependable precipitation (mm), ETo: potential evapotranspiration (mm), T: temperature (°C), A: soil total available water (mm). Red slashed lines represent 50 mm of available water in the moisture control section (AWCS) as established by Soil Survey Staff (1999).
Figura 5. Balance hídrico del suelo posterior a la infiltración calculado para los pedones: Biolley (A), Colorado de Acosta (B), Estación La Gamba (C), Rincón de Osa (D), Los Ángeles, Talamanca (E), y Cerro Coronel (F). 2016. DP: precipitación confiable (mm), ETo: evapotranspiración potencial (mm), T: temperatura (°C), A: agua total disponible en el suelo (mm). Las líneas rojas discontinuas representan 50 mm de agua disponible en la sección de control de humedad (AWCS), según lo establecido por el Soil Survey Staff (1999).
The SMR selected for all pedons assessed in the present study allowed us to designate the taxonomic Suborder for nine pedons (Table 4), while the SMR determined the taxonomic Subgroup for pedon P8 (Ustic Palehumults). Curiously, taxonomic subgroup designed for pedons P9 and P12 did not include an implicit SMR, in this case Andic Palehumults and Typic Palehumults, respectively.
5. Discussion
5.1. Pedotransfer functions performance and soil available water
The low values of soil available water (both TSAW and AWCS) observed in the pedons assessed (Figure 2) could be explained by the dominance of kaolinite, gibbsite, goethite, and hematite in their clay mineralogy (Camacho et al. 2021), which is characteristic of highly weathered soils like Ultisols and Oxisols (West et al. 1997, Buol and Eswaran 1999). All these minerals provide soil characteristics like strong grades of structure development, low capacity of water retention and good drainage (Lal 1979, West et al. 1997, Buol and Eswaran 1999). This Oxidic-Kaolinitic mineralogy has been reported for other Alfisols, Ultisols and Oxisols in Costa Rica (Alvarado et al. 2014, Pincus et al. 2017, Camacho et al. 2021).
Differences in clay minerals could affect the magnitude of wetting-drying phenomena during periods of high precipitation (surplus) and periods where ETo exceeds precipitation (deficit), as reported by Jackson (1973) and Forsythe (1976). Indeed, soil clay mineralogy strongly affects soil water retention capacity. For instance, when assessing the fit parameters of van Genuchten’s equation (the main model used to estimate and describe SWRC), they change dramatically due to variations in clay minerals, like the parameter α (air entry suction) is higher for kaolinitic than for montmorillonitic clay mineralogy samples, which leads to the underestimation of θ values through pedotransfer functions (Hodnett and Tomasella 2002).
Therefore, in absence of measured values for FC and PWP, pedotransfer functions (PTF’s) like those available in Rosetta1® software should be used carefully, especially in soils with clay mineralogy like those assessed in present study. In this regard, PTF’s developed and calibrated for soils from the humid tropics are quite scarce, and further research should be conducted to validate this approach (Hodnett and Tomasella 2002, Tomasella et al. 2000).
Table 3. Available water in control section (AWCS) along the months of the year and soil moisture regime assigned to twelve pedons studied in seven regions of Costa Rica.
Tabla 3. Agua disponible en la sección de control de humedad (AWCS) a lo largo de los meses del año y régimen de humedad del suelo asignado a doce pedones estudiados en siete regiones de Costa Rica.
|
Pedon |
|
Jan |
Feb |
Mar |
Apr |
May |
Jun |
Jul |
Aug |
Sep |
Oct |
Nov |
Dec |
|
Ustic soil moisture regime |
|||||||||||||
|
P1 Altos del Socorro |
|
|
|
|
|
|
|
|
|
|
|
|
|
|
|
|
|
|
|
|
|
|
|
|
|
|
|
|
|
AWCS (mm) |
|
0.00* |
0.00 |
0.00 |
0.00 |
0.00 |
13.41 |
0.00 |
16.15 |
19.75 |
19.75 |
19.75 |
0.00 |
|
|
|
|
|
|
|
|
|
|
|
|
|
|
|
|
P2 San Isidro de Monteromo |
|
|
|
|
|
|
|
|
|
|
|
||
|
|
|
|
|
|
|
|
|
|
|
|
|
|
|
|
AWCS (mm) |
0.00 |
0.00 |
0.00 |
0.00 |
0.00 |
13.41 |
0.00 |
16.15 |
19.64 |
19.64 |
19.64 |
0.00 |
|
|
|
|
|
|
|
|
|
|
|
|
|
|
|
|
|
P3 La Ceniza |
|
|
|
|
|
|
|
|
|
|
|
|
|
|
|
|
|
|
|
|
|
|
|
|
|
|
|
|
|
AWCS (mm) |
|
0.00 |
0.00 |
0.00 |
0.00 |
13.33 |
13.33 |
13.33 |
13.33 |
13.33 |
13.33 |
13.33 |
11.10 |
|
|
|
|
|
|
|
|
|
|
|
|
|
|
|
|
P4 El Porvenir |
|
|
|
|
|
|
|
|
|
|
|
||
|
|
|
|
|
|
|
|
|
|
|
|
|
|
|
|
AWCS (mm) |
|
0.00 |
0.00 |
0.00 |
0.00 |
15.31 |
15.31 |
15.31 |
15.31 |
15.31 |
15.31 |
15.31 |
0.00 |
|
|
|
|
|
|
|
|
|
|
|
|
|
|
|
|
P5 El Guayacán |
|
|
|
|
|
|
|
|
|
|
|
||
|
|
|
|
|
|
|
|
|
|
|
|
|
|
|
|
AWCS (mm) |
|
0.00 |
0.00 |
0.00 |
0.00 |
16.38 |
16.38 |
16.38 |
16.38 |
16.38 |
16.38 |
16.38 |
0.00 |
|
|
|
|
|
|
|
|
|
|
|
|
|
|
|
|
P8 Colorado de Acosta |
|
|
|
|
|
|
|
|
|
||||
|
|
|
|
|
|
|
|
|
|
|
|
|
|
|
|
AWCS (mm) |
|
0.00 |
0.00 |
0.00 |
0.00 |
16.38 |
16.38 |
16.38 |
16.38 |
16.38 |
16.38 |
16.38 |
0.00 |
|
Udic soil moisture regime |
|||||||||||||
|
P6 Crucitas de Cutris |
|
|
|
|
|
|
|
|
|
|
|
||
|
|
|
|
|
|
|
|
|
|
|
|
|
|
|
|
AWCS (mm) |
|
13.92 |
13.92 |
0.00 |
0.00 |
13.92 |
13.92 |
13.92 |
13.92 |
13.92 |
13.92 |
13.92 |
13.92 |
|
|
|
|
|
|
|
|
|
|
|
|
|
|
|
|
P7 Biolley |
|
|
|
|
|
|
|
|
|
|
|
||
|
|
|
|
|
|
|
|
|
|
|
|
|
|
|
|
AWCS (mm) |
|
2.16 |
0.00 |
0.00 |
16.38 |
16.38 |
16.38 |
16.38 |
16.38 |
16.38 |
16.38 |
16.38 |
16.38 |
|
|
|
|
|
|
|
|
|
|
|
|
|
|
|
|
P9 La Gamba |
|
|
|
|
|
|
|
|
|
|
|
||
|
|
|
|
|
|
|
|
|
|
|
|
|
|
|
|
AWCS (mm) |
|
12.79 |
12.79 |
0.00 |
10.89 |
12.79 |
12.79 |
12.79 |
12.79 |
12.79 |
12.79 |
12.79 |
12.79 |
|
|
|
|
|
|
|
|
|
|
|
|
|
|
|
|
P10 Rincón de Osa |
|
|
|
|
|
|
|
|
|
|
|
||
|
|
|
|
|
|
|
|
|
|
|
|
|
|
|
|
AWCS (mm) |
|
12.22 |
0.00 |
0.00 |
9.08 |
12.22 |
12.22 |
12.22 |
12.22 |
12.22 |
12.22 |
12.22 |
12.22 |
|
Perudic soil moisture regime |
|||||||||||||
|
P12 Los Ángeles |
|||||||||||||
|
|
|
|
|
|
|
|
|
|
|
|
|
|
|
|
AWCS (mm) |
|
15.55 |
15.55 |
15.55 |
15.55 |
15.55 |
15.55 |
15.55 |
15.55 |
15.55 |
15.55 |
15.55 |
15.55 |
|
|
|
|
|
|
|
|
|
|
|
|
|
|
|
|
P13 Cerro Coronel |
|
|
|
|
|
|
|
|
|
|
|
|
|
|
|
|
|
|
|
|
|
|
|
|
|
|
|
|
|
AWCS (mm) |
|
12.08 |
12.08 |
12.08 |
12.08 |
12.08 |
12.08 |
12.08 |
12.08 |
12.08 |
12.08 |
12.08 |
12.08 |
*Bold AWCS value: months with total depletion of available soil water in the control section.
Table 4. Taxonomic classification and selected features for twelve pedons sampled and described in seven sectors of Costa Rica.
Tabla 4. Clasificación taxonómica y características seleccionadas de doce pedones muestreados y descritos en siete sectores de Costa Rica.
|
Pedon’s name Taxonomic Subgroup |
Soil depth |
|
TSAW * |
Drainage class† |
|
Soil moisture regime |
|
Vegetation or Crop (Species) |
||
|
cm |
|
|
|
|||||||
|
P1 Altos del Socorro |
||||||||||
|
Kandiustalfic Eutrustox |
190.0 |
|
9.09 |
|
Well drained |
|
Ustic |
|
Coffee |
|
|
|
|
|
|
|
(Coffea arabiga) |
|||||
|
P2 San Isidro, Monteromo |
||||||||||
|
Typic Rhodustalfs |
190.0 |
|
9.78 |
|
Well drained |
|
Ustic |
|
Coffee |
|
|
|
|
|
|
|
(Coffea arabiga) |
|||||
|
P3 La Ceniza |
||||||||||
|
Plinthic Kandiustox |
200.0 |
|
11.79 |
|
Well drained |
|
Ustic |
|
Sugarcane |
|
|
|
|
|
|
|
|
|
|
|
(Saccharum officinarum) |
|
|
P4 El Porvenir |
||||||||||
|
Anionic Acrustox |
200.0 |
|
12.33 |
|
Well drained |
|
Ustic |
|
Sugarcane |
|
|
|
|
|
|
|
|
|
|
|
(Saccharum officinarum) |
|
|
P5 El Guayacán |
||||||||||
|
Anionic Acrustox |
200.0 |
|
11.37 |
|
Well drained |
|
Ustic |
|
Sugarcane |
|
|
|
|
|
|
|
|
|
|
|
(Saccharum officinarum) |
|
|
P8 Colorado de Acosta |
||||||||||
|
Ustic Palehumults |
180.0 |
|
14.55 |
|
Well drained |
|
Ustic |
|
Forest |
|
|
|
|
|
|
|
|
|
|
|
Various species |
|
|
P6 Crucitas de Cutris |
||||||||||
|
Plinthic Kandiudox |
170.0 |
|
11.80 |
|
Moderate drained |
|
Udic |
|
Grassland |
|
|
|
|
|
|
|
|
|
(Bracharya spp.) |
|||
|
P7 Biolley |
||||||||||
|
Typic Kandiudox |
180.0 |
|
13.13 |
|
Well drained |
|
Udic |
|
Coffee |
|
|
|
|
|
|
|
|
|
|
|
(Coffea arabiga) |
|
|
P9 La Gamba |
||||||||||
|
Andic Palehumults |
200.0 |
|
15.73 |
|
Well drained |
|
Udic |
|
Forest |
|
|
|
|
|
|
|
|
|
|
|
Various species |
|
|
P10 Rincón de Osa |
||||||||||
|
Rhodic Kandiudox |
200.0 |
|
9.39 |
|
Well drained |
|
Udic |
|
Forestry |
|
|
|
|
|
|
|
|
|
|
|
(Vochysia guatemalensis) |
|
|
P12 Los Ángeles |
||||||||||
|
Typic Palehumults |
200.0 |
|
14.40 |
|
Well drained |
|
Perudic |
|
Forest |
|
|
|
|
|
|
|
|
|
|
|
Various species |
|
|
P13 Cerro Coronel |
||||||||||
|
Andic Haploperox |
200.0 |
|
14.51 |
|
Well drained |
|
Perudic |
|
Forest |
|
|
|
|
|
|
|
Various species |
|||||
*TSAW: Total soil available water calculated throughout equation 5.
† Drainage classification assigned following Schoeneberger et al. (2002).
5.2. The soil water balance after the infiltration approach
Despite the availability in the literature of several models to compute the soil water balance and further soil moisture regime (SMR) such as EPIC, Billaux, or the classical Newhall (Newhall 1972, Costantini et al. 2002, Winzeler et al. 2013), most of them were developed, calibrated and validated in the temperate regions, covering some assumptions that could be impractical for tropical climate conditions like those present in Costa Rica (Rojas-Morales 2012). Indeed, some authors have reported discrepancies in the SMRs obtained with these models, for instance, the overestimation of Xeric regimes by the Billaux model, or the overestimation of Ustic regimes by the Newhall model (Constantini et al. 2002).
In this regard, the soil water balance approach developed in the present research included both climatic and edaphic variables, which are more adequate to describe the soil water dynamics and its implications into the SMR assignment under tropical conditions. For instance, the ETo is calculated with the model proposed by Hargreaves and Samani (1985), which requires minimal data, as well as the use of DP (a probabilistic rainfall value) and the soil water retention in the control section. This simple method provides a simpler framework to determine the SMRs when comparing with the aforementioned models, which tend to be cumbersome to use, or require more data that limit its use (Constantini et al. 2002, Bonfante et al. 2011, Wang et al. 2015).
According with Soil Survey Staff (1999) the SMR should be estimated considering monthly mean precipitation inferred from “data series from normal years” or a year plus minus one standard deviation of the long-term mean annual precipitation (µ ± σ). However, the use of “normal years” has been challenged by other authors, because reduces the amount of useful data for respective calculus, where one standard deviation becomes very restrictive (Costantini et al. 2002, Emadi et al. 2015).
In present study, DP allows a 75% probability of occurrence (probable rainfall in 3 of 4 years), resulting more suitable for studies under tropical climatic conditions, in agreement with those established by Hargreaves and Vogler (1985) and previous studies about rainfall, climate and agricultural potential in Costa Rica (Radulovich 1987, Carmona and Radulovich 1988).
Additionally, trends in the atmospheric variables assessed in present study were comparable to those described by Solano and Villalobos (2001) for corresponding climatic subregions, as well seasonal behavior on rainfall regime in Costa Rica (Rojas-Morales 2012).
Interestingly, midsummer droughts (MSD; called “veranillos” in Central America) were clearly observed during the middle of the year for two landscapes (Mountains of Acosta and Hojancha). The genesis of these MSD’s obeys to the influence of the several climatic phenomena, including fluctuations in the Eastern Pacific intertropical convergence zone (ITCZ), El Niño South Oscillation (ENSO) and the Intra Americas low-level jet (IALLJ), providing climatic conditions that reduce the rainfall amounts and distribution during July and August within Central America (Magaña et al. 1999, Amador 2008, Amador et al. 2006).
This trend in the atmospheric water balance (an MSD) has been previously reported and discussed for Central and North Pacific regions (Radulovich 1987, Carmona and Radulovich 1988, Radulovich 1990, Magaña et al. 1999), in agreement with our results observed (Figures 4 and 5).
5.3. Soil moisture regime, water availability and production potential
Despite results reported by van Wambeke (1987) in Costa Rica, where Udic SMR was assigned to the regions Valle del General and Acosta (pedons 3, 4, 5 and 8), the soil water balance after infiltration calculated for these pedons indicates that Ustic SMR is more suitable under these pedoclimatic conditions. Consistently, rainfall decreased during the middle of the year (Jun-Aug) in both landscapes (Figure 4 and 5), in agreement with the MSD’s reported for the Central-South Pacific region (Carmona and Radulovich 1988, Solano and Villalobos 2001, Rojas-Morales 2012).
Interestingly, this Ustic SMR assigned to the aforementioned pedons could explain the extensive distribution and elevated yields of coffee (Coffea arabiga L.) in the region of Acosta, as well the extensive crop of sugarcane (Saccharum officinarum L.) in Pérez Zeledón and Buenos Aires, due to the need of a water deficit period in the physiology of both crops to carry out certain processes such as: 1) quiescent growth period and the development of the inflorescence in coffee (DaMatta and Ramalho 2006) and 2) dry matter partition in the plant and further sucrose concentration increase in the stem before the sugarcane harvest (Inman-Bamber and Smith 2005).
The differences between the SMR obtained in present study and their corresponding values reported in literature (Figure 6) could be explained by differences in the calculation procedures, climatic parameters, and certain assumptions of Newhall model (van Wambeke 1987). For instance, this model assumes 50 mm of water available within control section, which is considerable higher than the values found in this study (Table 3).
In addition, the Newhall model handles monthly precipitation (PM) under two main conditions: 1) heavy rainfall (HP) events that immediately enters the soil (where HP = PM/2) and 2) light rainfall (LP) which could not infiltrate within the soil profile due to lost by evapotranspiration (Newhall 1972).
Soil infiltration process is described by Horton (1940) as a sequence of events where during a rainfall or irrigation event water enters the soil profile. When rainfall intensity exceeds infiltration capacity and fills surface depressions, water in excess moves as runoff, constituting a fundamental phenomenon in soil water balance. Evett et al. (2012) highlighted the runoff role on water flux change along soil pedon, which conditions the availability of soil water throughout the year.
In Costa Rica, several studies have been performed about runoff rates for Ultisols on coffee plantations (Harmand et al. 2007, Villatoro et al. 2015) and Andisols (Cannavo et al. 2011, Gómez-Delgado et al. 2011, Taugourdeau et al. 2014) where they reported runoff values corresponding to average monthly rainfall percentage between 3 and 8%. In present study it was selected a value corresponding to 5% of dependable precipitation (DP) for each soil water balance performed, due soil morphologic and physical conditions (relief, slope magnitude and soil texture) found for soils assessed were similar to those previously reported (Harmand et al. 2007, Villatoro et al. 2015).
5.4. Practical implications, caveats, and further research
The soil water balance after the infiltration approach resulted in a powerful tool to assess both the soil water dynamics and SMR assignment, considered satisfactory while determining SMR in highly weathered soils of Costa Rica, and versatile enough to work with limited data when comparing with other hydrologic models available into the literature for the soil moisture regime calculation and assignment (van Wambeke 1987, Costantini et al. 2002, Winzeler et al. 2013).
Nevertheless, this approach should be used carefully when assessing soils with an actual Aquic soil moisture regime, where the Soil Taxonomy requires evidence of redoximorphic features like mottles and low chroma values (Vepraskas and Sprecher 1997, Soil Survey Staff 1999) to assign this SMR.
In this regard, pedons P12 and P13 were classified within Perudic SMR because they did not present a water deficit period throughout the whole year (Figure 5).
However, these same climatic features under poorer drainage would provide conditions for a semi-permanent saturation (waterlogging) and further changes in the soil system’s redox status (Vepraskas and Sprecher 1997, Sparks 2003), resulting in morphological features like blue-grayish colors with low chroma values (Figure 7).
These features are typical of soils virtually free of dissolved oxygen (and subsequently, with an Aquic SMR), which is difficult to find out without digging the soil profile and describing the morphological soil features (Vepraskas and Sprecher 1997, Schoeneberger et al. 2002). Therefore, a sound soil description of these morphological properties (for instance, soil depth, genetic horizons, and their corresponding colors) coupled with the used of this soil water balance approach should be undertaken aiming to properly assign the SMR.
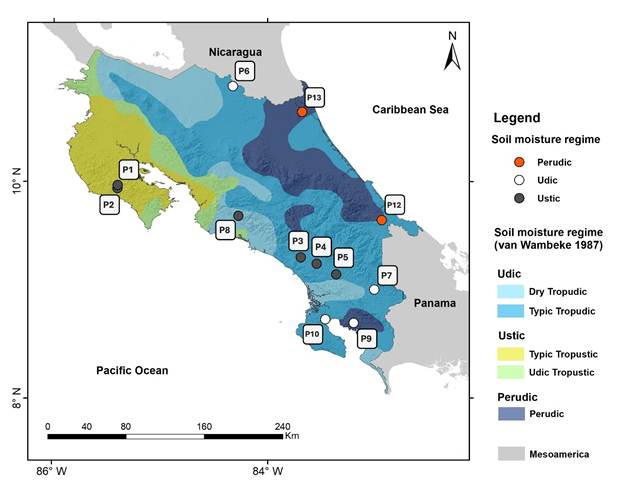
Figure 6. Geographic distribution of soil moisture regime within the Costa Rican territory according with van Wambeke (1987) and SMR determined for 12 pedons in present study (Red, white, and gray dots). Aquic SMR is not shown. SMR classes were consulted from van Wambeke (1987).
Figura 6. Distribución geográfica de los distintos regímenes de humedad del suelo en el territorio costarricense de acuerdo con van Wambeke (1987) y los SMR determinados para 12 pedones evaluados en el presente estudio (puntos rojos, blancos y grises). El régimen de humedad ácuico no se muestra. Las clases de SMR fueron consultadas de van Wambeke (1987).
We encourage further research where this soil water balance approach could be tested in other soil orders like Andisols or Inceptisols, soils with considerable surface extension within the territory of Costa Rica (Mata et al. 2020), where other important agricultural activities take place (Camacho-Umaña et al. 2024), aiming to extend the use of soil water balance approach and validate its potential results.
Additionally, the use of sensors
and other techniques which provide continuous measurements of soil water
content (Hidalgo-Campos and Camacho-Umaña 2024) would improve the accuracy of
this soil water balance approach while assessing the soil water dynamics and
the corresponding identification of months with soil water deficit (Costantini et
al. 2002).
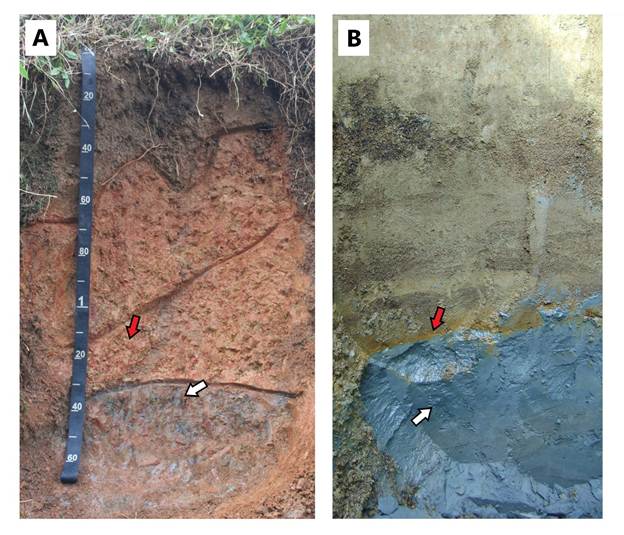
Figure 7. Redoximorphic features assessed in soils from Costa Rica: A) Mottles and blueish colors matrix at the lowlands of San Carlos (Crucitas de Cutris) Province of Alajuela, and B) Iron-reduced matrix in horizon (blue-grayish color) and oxidized boundary (yellowish colors) at the lowlands of Matina (Carradí de Matina), Province of Limón. Red arrows indicate oxidized Fe forms. White arrows indicate reduced Fe forms. Picture 7B is kindly provided by the students of AF4404 “Génesis y clasificación de suelos” course (2014).
Figura 7. Características redoximórficas evaluadas en suelos de Costa Rica: A) Moteados y matriz de colores azulados en las tierras bajas de San Carlos (Crucitas de Cutris), provincia de Alajuela, y B) Matriz con reducción de hierro en el horizonte (color azul grisáceo) y límite oxidado (colores amarillentos) en las tierras bajas de Matina (Carrandí de Matina), provincia de Limón. Las flechas rojas indican formas oxidadas de Fe. Las flechas blancas indican formas reducidas de Fe. La imagen 7B fue amablemente proporcionada por los estudiantes del curso AF4404 “Génesis y clasificación de suelos” (2014).
6. Conclusions
The soil water balance after infiltration approach developed in present study resulted satisfactorily in describing soil moisture dynamics throughout the year, in agreement with climatic patterns reported in the literature. Despite disagreements with SMR previously reported some pedons assessed in present study, our results showed a better agreement with climate conditions and vegetation developing (crops or forestry) within the corresponding regions.
Soils sampled and described in present study presented low soil available water values, explained by their great pedologic development and presence of kaolinite and oxy-hydroxides of Fe and Al as main clay minerals. This condition could explain divergences with soil moisture regime previously estimated through Newhall model, where AWCS assumed is quite higher than that estimated from direct soil water retention measurements.
Further research should be performed to calibrate and validate PTF’s in different soil orders from Costa Rica, using the approach developed in the present study for pedons with limited data. We recommend continuing the evaluation of soil water balance approach in other soil orders in Costa Rica under different climatic regions, in order to evaluated performance on SMR determination, as well as soil water balance and soil available water dynamics.
Acknowledgements
We would like to thank to Instituto Meteorológico Nacional (IMN), Instituto Costarricence de Electricidad (ICE), Instituto del Café de Costa Rica (ICAFE) and CoopeAgri R.L. for their thoughtful collaborating with meteorological data, fundamental for development of present study.
Also, we thank Laboratorio de Recursos Naturales and Laboratorio de Suelos y Foliares at Universidad de Costa Rica for their help with fieldtrips, sampling and describing soil pedons, as well soil physical and chemical analysis.
Our appreciation to the students of AF4404 “Génesis y clasificación de suelos” course at Universidad de Costa Rica (Campos-Boza, S; Castro, M; Quesada, M; Ruiz-Campos, C; Vargas-Barrantes, P), for providing the picture for Figure 7B.
Literature cited
Allen, RG; Pereira, LS; Raes, D. 1998. Crop evapotranspiration. Guidelines for computing crop water requirements. FAO Irrigation and drainage paper 56. Available on http://www.fao.org/docrep/X0490E/X0490E00.htm#Contents
Alvarado, A. 1985. El origen de los suelos. Serie materiales de enseñanza N°. 24. Turrialba, Costa Rica. Centro Agronómico Tropical de Investigación y Enseñanza (CATIE). 54 p.
Alvarado, A; Mata R; Chinchilla, M. 2014. Arcillas identificadas en suelos de Costa Rica a nivel generalizado durante el período 1931-2014: II. Mineralogía de arcillas en suelos con características vérticas y oxídico caoliníticas. Agronomía Costarricense 38(1):107-131. DOI: https://doi.org/10.15517/rac.v38i1.15161
Amador, JA. 2008. The Intra-Americas sea low-level jet: overview and future research. Annals of New York Academy of Science. 1146:153-188. DOI: https://doi.org/10.1196/annals.1446.012
Amador, JA; Alfaro, EJ; Lizano, OG; Magaña, VO. 2006. Atmospheric forcing of the eastern tropical Pacific: a review. Progress in Oceanography 69:101-142. DOI: https://doi.org/10.1016/j.pocean.2006.03.007
Andersson, JCM; Pechlivanidis, IG; Gustafsson, D; Donnelly, C; Arheimer, B. 2015. Key factors for improving large-scale hydrological model performance. European Water 49:77-88.
Bautista, F; Bautista, D; Delgado-Carranza, C. 2009. Calibration of the equations of Hargreaves and Thornthwaite to estimate the potential evapotranspiration in semi-arid and subhumid tropical climates for regional applications. Atmósfera 22(4):331-348.
Bonfante, A; Basile, A; Manna, P; Terribile, F. 2011. Use of physically based models to evaluate USDA soil moisture classes. Soil Science Society of America Journal 75(1):181-191. DOI: https://doi.org/10.2136/sssaj2009.0403
Bouma, J. 2012. Hydropedology as a powerful tool for environmental policy and regulations: toward sustainable land use, management and planning. In Lin, H (ed.). Hydropedology: synergistic integration of soil science and hydrology. Academic/Elsevier BV. Amsterdam. p. 483-512. DOI: http://dx.doi.org/10.1016/B978-0-12-386941-8.00015-0
Buol, SW; Eswaran, H. 1999. Oxisols. Advances in Agronomy 68:151-195. DOI: https://doi.org/10.1016/S0065-2113(08)60845-7
Buol, SW; Southard, RJ; Graham RC; McDaniel, PA. 2011. Soil genesis and classification. 5 ed. Iowa, USA. Blackwell Publishing. 494 p.
Camacho, ME; Mata, R; Barrantes-Víquez, M; Alvarado, A. 2021. Morphology and characteristics of eight Oxisols in contrasting landscapes of Costa Rica. Catena 197:104992. DOI: https://doi.org/10.1016/j.catena.2020.104992
Camacho-Umaña, ME; Quesada-Román, A; Villatoro-Sánchez, M; Alemán-Montes, B; Mata, R; Henríquez-Henríquez, C; Céspedes-Rivera, JE; Céspedes-Rivera, M; Alvarado A. 2024. Agricultural Landscapes of Costa Rica. In Quesada-Román, A (ed.). Landscapes and Landforms of Costa Rica. World Geomorphological Landscapes. Springer Nature, Switzerland. p. 221-258. DOI: https://doi.org/10.1007/978-3-031-64940-0_11
Cannavo, P; Sansoulet, J; Harmand, JM; Siles, P; Dreyer, E; Vaast, P. 2011. Agroforestry associating coffee and Inga densiflora results in complementarity for water uptake and decreases deep drainage in Costa Rica. Agriculture, ecosystems & environment 140(1):1-13. DOI: https://doi.org/10.1016/j.agee.2010.11.005
Carmona, G; Radulovich, R. 1988. Metodología de evaluación de veranillos y de siembra temprana como estrategia para minimizar sus efectos. Turrialba 38(3):215-222.
Coopeagri (CoopeAgri El General R.L). 2015. Datos climáticos de las estaciones Finca La Ceniza, Finca el Porvenir y Finca el Guayacán. Pérez Zeledón, Costa Rica. Documento electrónico. s. p.
Costantini, EA; Castelli, F; Raimondi, S; Lorenzoni, P. 2002. Assessing soil moisture regimes with traditional and new methods. Soil Science Society of America Journal 66(6):1889-1896. DOI: https://doi.org/10.2136/sssaj2002.1889
DaMatta, FM; Ramalho, JDC. 2006. Impacts of drought and temperature stress on coffee physiology and production: a review. Brazilian Journal of Plant Physiology 18(1):55-81. DOI: https://doi.org/10.1590/S1677-04202006000100006
de Sousa Lima, JR; Antonino, ACD; de Souza, ES; Hammecker, C; Montenegro, SMGL, de Oliveira Lira, CAB. 2013. Calibration of Hargreaves-Samani equation for estimating reference evapotranspiration in sub-humid region of Brazil. Journal of Water Resource and Protection 5:1-5. DOI: http://dx.doi.org/10.4236/jwarp.2013.512A001
Emadi, M; Shahriari, AR; Sadegh-Zadeh, F; Jalili Seh-Bardan, B; Dindarlou, A. 2015. Geostatistics-based spatial distribution of soil moisture and temperature regime classes in Mazandaran province, northern Iran. Archives of Agronomy and Soil Science 62(4):502-522. DOI: https://doi.org/10.1080/03650340.2015.1065607
Evett, SR; Schwartz, RC; Casanova, JJ; Heng, LK. 2012. Soil water sensing for water balance, ET and WUE. Agricultural Water Management 104:1-9. DOI: https://doi.org/10.1016/j.agwat.2011.12.002
Fernández-Moya, J; Algeet-Abarquero, N; Salazar, C; Salazar, S; Vargas, O; Chinchilla, M; Mata, R. 2014. Balance hídrico de suelos para la determinación del régimen de humedad en clasificaciones de suelos. Suelos Ecuatoriales 44(1):1-10.
Forsythe, W. 1976. Formula for calculating from weather data the residual soil moisture during soil drying. Turrialba 26 (1):60-67.
Gee, GW; Or, D. 2002. 2.4 Particle‐size analysis. In Dane, JH; Topp, GC (eds.). Methods of soil analysis, part 4 – physical methods. Madison, Wisconsin, USA. Soil Science Society of America. p. 255-293. DOI: https://doi.org/10.2136/sssabookser5.4.c12
Gentilucci, M; Bufalini, M; Materazzi, M; Barbieri, M; Aringoli, D; Farabollini, P; Pambianchi, G. 2021. Calculation of potential evapotranspiration and calibration of the Hargreaves equation using geostatistical methods over the last 10 years in central Italy. Geosciences 11(8):348. DOI: https://doi.org/10.3390/geosciences11080348
Gómez-Delgado, F; Roupsard, O; le Maire, G; Taugourdeau, S; Perez, A; Van Oijen, M; Vaast, P; Rapidel, B; Harmand, JM; Voltz, M; Bonnefond, JM; Imbach, P; Moussa, R. 2011. Modelling the hydrological behaviour of a coffee agroforestry basin in Costa Rica. Hydrology and Earth System Sciences 15:369-392. DOI: https://doi.org/10.5194/hess-15-369-2011
Grossman, RB; Reinsch, TG. 2002. 2.1 Bulk Density and Linear Extensibility. In Dane, JH; Topp, GC (eds.). Methods of soil analysis, part 4 – physical methods. Madison, Wisconsin, USA. Soil Science Society of America. p. 201-228. DOI: https://doi.org/10.2136/sssabookser5.4.c9
Hancock, JK; Hargreaves, GH. 1977. Precipitación, clima y potencial para producción agrícola en Costa Rica. Utah, USA. Universidad del Estado de Utah. 136 p.
Hargreaves, GH. 1977. Precipitation adequacies for short time periods for Central America. Logan Utah, USA. Utah State University. 12 p.
Hargreaves, GH. 1994. Simplified coefficients for estimating monthly solar radiation in North America and Europe. Departmental Paper, Department of Biology and Irrigation Engeneering. Logan, Utah. Utah State University. s. p.
Hargreaves, GH; Samani, ZA. 1985. Reference crop evapotranspiration from temperature. Applied Engenering in Agriculture 1(2):96-99. DOI: http://dx.doi.org/10.13031/2013.26773
Hargreaves, GH; Vogler, KJ. 1985. Modelos hidrológicos sencillos. In Experiences in the development and Application of Mathematical Models in Hydrology and Water Resources in Latin America (Proceedings of the Tegucigalpa Hydromath Symposium) IAHS Publication N°. 152. p. 163-73.
Harmand, JM; Ávila, H; Dambrine, E; Skiba, U; De Miguel Magaña, S; Renderos-Durán, RV; Oliver, R; Jiménez, F; Beer, J. 2007. Nitrogen dynamics and soil nitrate retention in a Coffea arabica – Eucalyptus deglupta agroforestry system in Southern Costa Rica. Biogeochemistry 85:125-139. DOI: https://doi.org/10.1007/s10533-007-9120-4
Hidalgo-Campos, CM; Camacho-Umaña, ME. 2024. Potencial hídrico y contenido del agua en el suelo: métodos de análisis disponibles y sus implicaciones en el manejo de los recursos suelo y agua. Agronomía Costarricense 47(2):169-200. DOI: http://dx.doi.org/10.15517/rac.v48i2.62575
Hodnett, MG; Tomasella, J. 2002. Marked differences between van Genuchten soil water-retention parameters for temperate and tropical soils: a new water-retention pedo-transfer functions developed for tropical soils. Geoderma 108(3-4):155-180. DOI: https://doi.org/10.1016/S0016-7061(02)00105-2
Horneck, DA; Miller, RO. 1998. Determination of total nitrogen in plant tissue. In Kalra, YP (ed.). Handbook of reference methods for plant analysis., Boca Raton, FL. Soil and Plant Analysis Council Inc. and CRC Press. p. 75-83.
Horton, RE. 1940. An approach towards physical interpretation of infiltration capacity. Proceedings of the Soil Science Society of America 5:399-417. DOI: https://doi.org/10.2136/sssaj1941.036159950005000C0075x
Husak, GJ; Michaelsen, J; Funk, C. 2007. Use of the gamma distribution to represent monthly rainfall in Africa for drought monitoring applications. International Journal of Climatology: A Journal of the Royal Meteorological Society 27(7):935-944. DOI: https://doi.org/10.1002/joc.1441
ICE (Instituto Costarricense de Electricidad). 2015. Datos climáticos obtenidos de las estaciones 69551, 69575, 69577, 69704, 87012, 87014, 87016 y 98066. San José, CR, Ingeniería y construcción. Documento electrónico. s. p.
ICAFE (Instituto Costarricense del Café). 2015. Datos climáticos obtenidos de las estaciones Pérez Zeledón y Hojancha. Heredia, Costa Rica. Clima del Café. Documento electrónico. s. p.
IMN (Instituto Meteorológico Nacional). 2015. Datos climáticos obtenidos de las estaciones 69635, 69713, 72105, 85012, 85021, 88005, 88045 y 98087. San José, Costa Rica. Documento electrónico. s. p.
Inman-Bamber, NG; Smith, DM. 2005. Water relations in sugarcane and response to water deficits. Field crops research 92(2):185-202. DOI: https://doi.org/10.1016/j.fcr.2005.01.023
Jackson, RD. 1973. Diurnal changes in soil water content during drying. Field soil water regime. SSSA special publication 5:37-55. DOI: https://doi.org/10.2136/sssaspecpub5.c3
Kramer, PJ. 1969. Plant and soil water relationships: a modern synthesis. New York, USA. McGraw-Hill inc. 482 p.
Klute, A. 1986. Water retention: laboratory methods. In A. Klute (ed.). Methods of soil analysis. Part 1. Physical and mineralogical methods, second ed. Agronomy Monography. 9. ASA and SSSA, Madison, WI. p. 635-662. DOI: https://doi.org/10.2136/sssabookser5.1.2ed.c26
Lal, R. 1979. Physical characteristics of soils in the tropics: determination and management. In Lal, R; Greenland DJ (eds.). Soil Physical Properties and Crop Production in the Tropics. John Wiley and Sons. Chichester. p. 7-44.
Lal, R. 2015. Research and Development Priorities in Water Security. Agronomy Journal 107(4):1567-1572. DOI: https://doi.org/10.2134/agronj15.0046
Larkin, NK; Harrison, DE. 2005. Global seasonal temperature and precipitation anomalies during El Niño autumn and winter. Geophysical Research Letters 32(16). DOI: https://doi.org/10.1029/2005GL022860
Lima Junior, JD; Arraes, FDD; Macêdo, KG; Oliveira, JD; Oliveira, WC. 2018. Spatization of reference evapotranspiration by Hargreaves and Samani equation adjusted to the state of Ceará. Revista Brasileira de Agricultura Irrigada 12(2):2510-2518. DOI: http://dx.doi.org/10.7127/rbai.v12n200768
Lin, H. 2010. Linking principles of soil formation and flow regimes. Journal of Hydrology 393:3-19. DOI: https://doi.org/10.1016/j.jhydrol.2010.02.013
Lin, H; Bouma, J; Pachepsky, Y; Western, A; Thompson, J; van Genuchten, M; Lilly, A. 2006. Hydropedology: synergistic integration of pedology and hydrology. Water Resources Research 42(5):1-13. DOI: https://doi.org/10.1029/2005WR004085
Maldonado, T; Alfaro, EJ; Hidalgo, HG. 2018. A review of the main drivers and variability of Central America’s Climate and seasonal forecast systems. Revista de Biología Tropical 66(1): S153-S175. DOI: https://doi.org/10.15517/rbt.v66i1.33294
Magaña, V; Amador, JA; Medina, S. 1999. The midsummer drought over Mexico and Central America. Journal of Climate 12(6):1577-1588. DOI: https://doi.org/10.1175/1520-0442(1999)012%3C1577:TMDOMA%3E2.0.CO;2
Mata, R; Rosales, A; Sandoval, D; Vindas, E; Alemán, B. 2020 Mapa de suelos de Costa Rica (Ordenes) Centro de Investigaciones Agronómicas. Universidad de Costa Rica. Escala 1:200.000 San José, Costa Rica.
Monteith, JL. 1965. Evaporation and environment. In Fogg, GE (ed.). The State and Movement of Water in Living Organisms. Cambridge, UK. Cambridge University Press. p. 205-234.
Moeletsi, ME; Walker, S; Hamandawana, H. 2013. Comparison of the Hargreaves and Samani equation and the Thornthwaite equation for estimating dekadal evapotranspiration in the Free State Province, South Africa. Physics and Chemistry of the Earth 66:4-15. DOI: https://doi.org/10.1016/j.pce.2013.08.003
Munsell. (Munsell Color Company). 1994. Munsell soil color charts. Maryland, USA.
Newhall, F.1972. Calculation of soil moisture regimes from climatic record. Soil Conservation Service, USDA, Washington, DC. Revision 4. Mimeographed. s. p.
Penman, HL. 1948. Natural evaporation from open water, bare soil, and grass. Proceedings of the Royal Society of London. Series A Mathematical and Physical Sciences A193:120-146. DOI: https://doi.org/10.1098/rspa.1948.0037
Pincus, LN; Ryan, PC; Huertas, FJ; Alvarado, GE. 2017. The influence of soil age and regional climate on clay mineralogy and cation exchange capacity of moist tropical soils: a case study from Late Quaternary chronosequences in Costa Rica. Geoderma 308:130-148. DOI: https://doi.org/10.1016/j.geoderma.2017.08.033
Radulovich, R. 1987. AQUA, a model to evaluate water deficits and excesses in tropical cropping. Part I. Basic assumptions and yield. Agricultural and forest meteorology 40(4):305-321. DOI: https://doi.org/10.1016/0168-1923(87)90044-X
Radulovich, R. 1990. AQUA, a model to evaluate water deficits and excesses in tropical cropping. Part II. Regional yield prediction. Agricultural and forest meteorology 52(3):253-261. DOI: https://doi.org/10.1016/0168-1923(90)90084-J
Rai, RK; Singh, VP. 2012. Global water balance and agronomic production in relation to food security. In R. Lal, R; Stewart B (ed.). Advances in soil science: soil water and agronomic productivity. Taylor & Francis, Boca Raton, FL. s. p.
Richards, LA. 1941. A pressure-membrane extraction apparatus for soil solution. Soil Science 51:377-386. DOI: https://doi.org/10.1097/00010694-194105000-00005
Rojas-Morales, N. 2012. Índice de estacionalidad individual de los regímenes de precipitación en Costa Rica y su comportamiento según región climática. Tópicos Meteorológicos y Oceanográficos 11(1):30-43.
R Studio Team. 2015. RStudio: Integrated Development for R. RStudio, Inc., Boston, MA URL http://www.rstudio.com/.
Samani, Z. 2000. Estimating solar radiation and evapotranspiration using minimum climatological data. Journal of Irrigation and Drainage Engineering 126(4):265-267. DOI: https://doi.org/10.1061/(ASCE)0733-9437(2000)126:4(265)
Schaap, MG; Leij, FJ; van Genuchten, MT. 2001. Rosetta: a computer program for estimating soil hydraulic parameters with hierarchical pedotransfer functions. Journal of hydrology 251(3-4):163-176. DOI: https://doi.org/10.1016/S0022-1694(01)00466-8
Schoeneberger, PJ; Wysocki, DA; Benham, EC; Broderson, WD. 2002. Field book for describing and sampling soils. Version 3.0. Natural Resources Conservation Service; National Soil Survey Center, Lincoln, NE. s. p.
Soil Survey Staff. 1999. Soil taxonomy: a basic system of soil classification for making and interpreting soil surveys.2 ed. Agricultural Handbook n 436. USDA. 871 p.
Soil Survey Staff. 2014a. Kellogg Soil Survey Laboratory Methods Manual. Soil Survey Investigations Report No. 42, Version 5.0. R. Burt andSoil Survey Staff (ed.). U.S. Department of Agriculture, Natural Resources Conservation Service. s. p.
Soil Survey Staff. 2014b. Keys to Soil Taxonomy, 12 ed. USDA-Natural Resources Conservation Service, Washington, DC. s. p.
Solano, J; Villalobos, R. 2001. Aspectos fisiográficos aplicados a un bosquejo de regionalización geográfico climático de Costa Rica, Tópicos Meteorológicos y Oceanográficos. 8:26-39.
Sparks, DL. 2003. Environmental Soil Chemistry. Elsevier Academic Press, 352 p.
Taugourdeau, S; le Maire, G; Avelino, J; Jones, JR; Ramirez, LG; Quesada, MJ; Vaast, P. 2014. Leaf area index as an indicator of ecosystem services and management practices: an application for coffee agroforestry. Agriculture, Ecosystems & Environment 192:19-37. DOI: https://doi.org/10.1016/j.agee.2014.03.042
Tejedor, M; Jiménez, CC; Díaz F. 2002. Soil Moisture Regime Changes in Tephra-Mulched Soils. Soil Science Society of America Journal 66(1):202-206. DOI: https://doi.org/10.2136/sssaj2002.2020
Thornthwaite, CW. 1954. The measurement of potential evapotranspiration. Mather, Seabrook, NJ. 225 p.
Tomasella, J; Hodnett, M.G; Rossato, L. 2000. Pedotransfer functions for the estimation of soil water retention in Brazilian soils. Soil Sci. Soc. Am. J. 64:327-338.
DOI: https://doi.org/10.2136/sssaj2000.641327x
van Genuchten, MT. 1980. A closed‐form equation for predicting the hydraulic conductivity of unsaturated soils. Soil science society of America journal 44(5):892-898. DOI: https://doi.org/10.2136/sssaj1980.03615995004400050002x
van Wambeke, AR. 1987. Soil moisture and temperature regimes of Central America Caribbean, Mexico. SMSS. Soil Cons. Serv. USDA. Tech. Monogr. 16. Cornell Univ., New York. s. p.
van Wambeke, AR. 2000. The Newhall simulation model for estimating soil moisture & temperature regimes. Department of Crop and Soil Sciences. Cornell University, Ithaca, NY. s. p.
Vepraskas, MJ., Sprecher, SW. 1997. Overview of aquic conditions and hydric soils. In Vepraskas, MJ; Sprecher, SW (eds.). Aquic conditions and hydric soils: the problem soils (Vol. 50). SSSA, Madison, WI, USA. p.1-22. DOI: https://doi.org/10.2136/sssaspecpub50.c1
Villatoro, M; Le Bissonnais, Y; Moussa, R; Rapidel, B. 2015. Temporal dynamics of runoff and soil loss on a plot scale under a coffee plantation on steep soil (Ultisol), Costa Rica. Journal of Hydrology 523:409-426. DOI: https://doi.org/10.1016/j.jhydrol.2015.01.058
Wang, X; Williams, JR; Williams, CO; Nichols, J; Jeong, J; Schoeneberger, P; Norfleet, L; Angerer, JP. 2015. Development of a tool to predict soil moisture and soil temperature regimes. Soil Horizons 56(3):1-11. DOI: https://doi.org/10.2136/sh14-09-0012
West, LT; Sumner, FBM; Kang, BT. 1997. Ultisols: characteristics and impacts on society. Advances in agronomy 63:179-239. DOI: https://doi.org/10.1016/S0065-2113(08)60244-8
Winzeler, HE; Owens, PR; Waltman, SW; Waltman, WJ; Libohova, Z; Beaudette, D. 2013. A methodology for examining changes in soil climate geography through time: US soil moisture regimes for the period 1971–2000. Soil Science Society of America Journal 77(1):213-225. DOI: https://doi.org/10.2136/sssaj2012.0123
Wolter, K; Timlin, MS. 2011. El Niño/Southern Oscillation behaviour since 1871 as diagnosed in an extended multivariate ENSO index (MEI. ext). International Journal of Climatology 31(7):1074-1087. DOI: https://doi.org/10.1002/joc.2336
 |